1.
|
Topological
Overview |
You
begin with an overall view of the entire conversation space, be it live
chat, mailing list, or email. Different sorts of conversations are represented
by different patterns. You explore the map with your mouse. Information
about the different conversations pop-up as you move over the patterns.
|
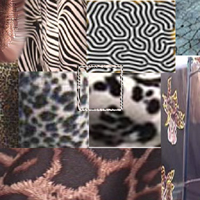
the topology of
the entire conversation as represented by animal patters
|
2.
|
Diving
Into the Map |
If
you hover in place for very long, the system interprets this as a sign of
interest and takes you down into the conversation you were over. The 2D
map takes on a third dimension as you dive into it. |
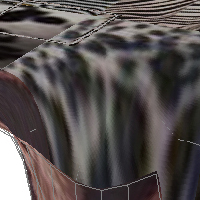
diving into the
map over the cow pattern
|
3.
|
Personal
Disks |
Individual
users are represnted in the space by personal disks. The disks begins forming
on the first interaction with the space, with the inner ring taking on the
pattern of the first conversation entered into by the user. Subsequent interactions
with other participants in particular conversations causes additional rings
to accrete to the disk. The growth of this disk creates a singular visual
identity for the user in the space. |
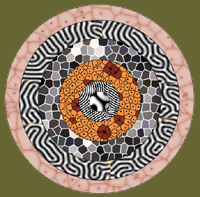
a personal disk
with several rings of growth
|
|
4.
|
Connecting
the Posts... |
Users, represented
by their disks, are connected to other participants via 2 mechanism
- self-connection
when a user creates a post, she can choose to explicitely link it to
other posts
- system analysis
the system performs its own conversational analysis and creates connections
on its own
|
|
|
5.
|
...And
Creating Animal Patters |
Translating
the patterns made by the posts and their interconnections into animal-like
patterns |
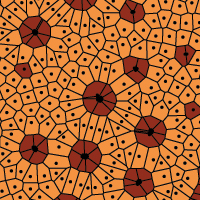
a pattern generated
with M. Walters' software for emulating the growth of animal patterns
|
| 7.
|
Architecture |
- Analysis
Conversational analysis software monitors the communication, providing
information as to both qualitative and quantitative aspects.
- Visual Interpretation
The information
provided by the CA software gets translated into meaningual visuals
- preferably meaningful visuals that look something like animal patters
- Data Flow
A standard client-server model with a fairly thick client will support
this architecture.
|
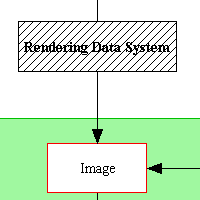
a system diagram
|


